When Guggenheim Partners, a major Investment, Securities and Financial company was seeking to continue in its role as a thought leader in their industry, they turned to Open i Networks for data visualization.
Open i Networks was hired to help enhance GP’s newsletters and deepen the engagement of their clients by adding a complex set of data visualization components to their presentations.
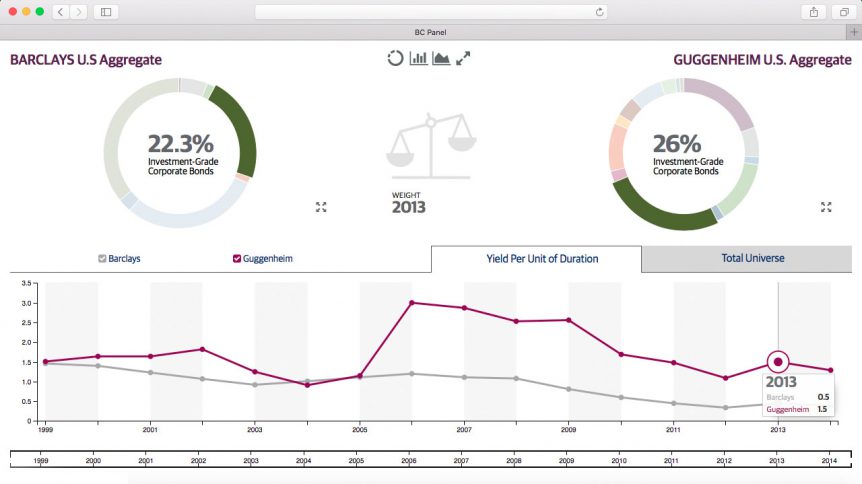
In just four short months, working with the in-house Guggenheim marketing team, Open i Networks created a tool that allows the data to tell the fund’s story by having viewers engage with the numbers through a series of engaging interactive data visualization mechanisms.
Our project design team helped to vastly improve the capacity to develop a continuing series of charts and graphs to illustrate important concepts surrounding financial markets and their performance for a sophisticated and savvy audience.
Elements of this tool can be embedded in a digital newsletter for distribution and enables GP to completely maintain brand standards while presenting financial statistics in an in-depth and compelling manner.